Tuesday’s markets were full of curious price moves as different asset groups jostled for investor attention. From a macro perspective, there is still no clear sign of which direction the next significant move will be, but indications are forming.
The key indicator is the US Dollar and it is positioned right on top of a key price level. The direction it takes will determine prices across the world. It’s a case of “stick or twist” for the global markets.
USD & Gold
All things still start with the US Dollar. A slide in US Treasury bond yields on Tuesday was soon followed by weakness in the dollar. The US Dollar Basket, which prices USD against a basket of G7 currencies, has had a good run for the last fortnight; however, this week, something has changed.
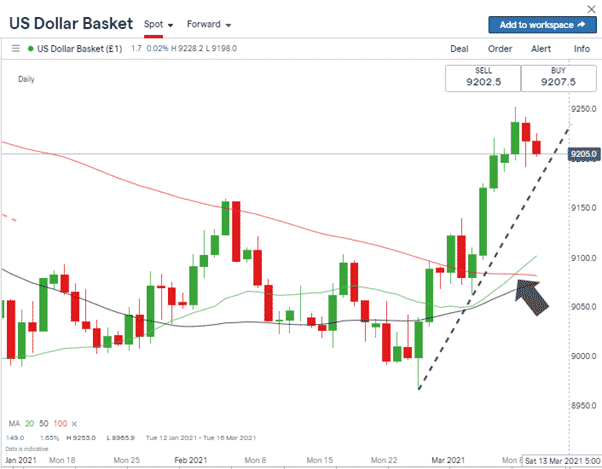
Source: IG
The upward intersection of the 20 SMA through the 100 SMA on Monday was supposed to be a bullish confirmation, but after peaking at 92.53, the Basket Index has since fallen back to test 92.00.
The 92.00 price level has become one of the major support/resistance levels of the index. Its multi-year downward trend took three attempts and many months of such pressure to finally break 92.00. Just after the open of European markets on Wednesday, the USD Basket Index was sitting right on top of it at 92.03
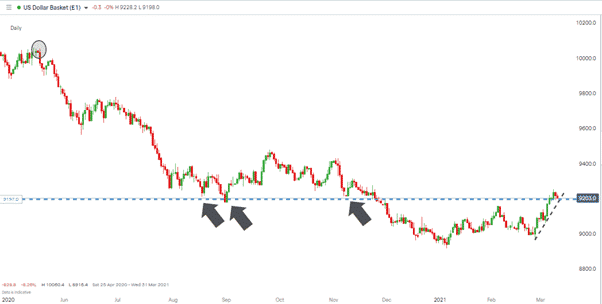
Source: IG
Precious metals, GBPUSD and EURUSD all had good days on Tuesday as dollar weakness spread across the markets. The bigger question is whether recent dollar strength is just price coming back to kiss the 92.00 level before continuing its downward price move, which would result in buying pressure in risk-on assets.
US Tech Enjoys its Best Day of the Year
US Tech posted its most substantial daily gain since November of last year. The Nasdaq Composite was up 3.7% as dip-buyers hurried back into some of their favourite names. The move was helped by US bond yields sliding, but the price chart for the NAS 100 shows no sign, yet, of the downward trend line being broken.
NAS 100 – Daily price chart – strength but no trend line break & lower volumes
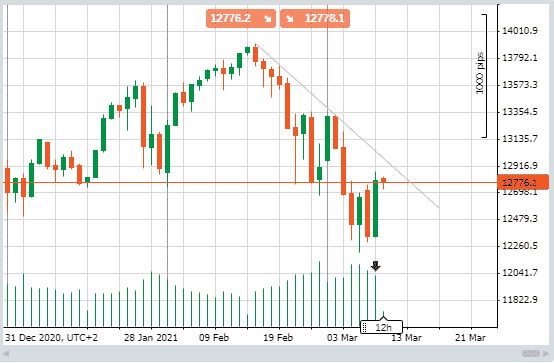
Source: Pepperstone
Further support for the argument that this is a relief rally rather than a high-momentum break out is found in the drop in trading volumes. Bulls now face a difficult question. Was Tuesday a day when sellers just didn’t turn up, or have the sellers lost interest with the index posting an 11% correction from its mid-Feb highs?
The support at the 12260 price-level is significant. A move below the low of Friday the 5th at 12211 would point to bearish price action. The fact that that level has been tested over the last four days and has still held will be playing on the bulls’ minds. Despite the low trade volumes, many will be buying in at these levels with stop losses in the 12200 area; the alternative is to wait to see if price can break the trend-line.
If you want to know more about this topic, or have been scammed by a fraudulent broker, please contact us at [email protected].
Related Articles
- Forex vs Crypto: What’s Better For Beginner Traders?
- Three Great Technical Analysis Tools for Forex Trading
- What Does Binance Being Kicked Out of Belgium Mean for Crypto Prices?
- Crypto Traders and Coin Prices Face New Challenge as Binance Gives up its FCA Licence
- Interpol Declares Investment Scams “Serious and Imminent Threat”
- Annual UK Fraud Audit Reveals Scam Hot-Spots
Forex vs Crypto: What’s Better For Beginner Traders?
Three Great Technical Analysis Tools for Forex Trading
Safest Forex Brokers 2025
| Broker | Info | Best In | Customer Satisfaction Score | ||
|---|---|---|---|---|---|
| #1 |
|
Global Forex Broker |

BEST SPREADS
Visit broker
|
|
|
| #2 |
|
Globally regulated broker |
BEST CUSTOMER SUPPORT
Visit broker
|
|
|
| #3 |
|
Global CFD Provider |
Best Trading App
Visit broker
|
|
|
| #4 |
|
Global Forex Broker |
Low minimum deposit
Visit broker
|
|
|
| #5 |
|
Global Forex Broker |
Low minimum deposit
Visit broker
|
|
|
| #6 |
|
CFD and Cryptocurrency Broker |
CFD and Cryptocurrency
Visit broker
|
|
|
|
|
|||||

Forex Fraud Certified Brokers

Stay up to date with the latest Forex scam alerts
Sign up to receive our up-to-date broker reviews, new fraud warnings and special offers direct to your inbox