
You don’t have to be very technical minded to make use of technical analysis in your forex trading. Thankfully, today’s online trading platforms have lots of special powers built into them, which effectively takes the ball out of your court. There are plenty of reasons to learn to use your platform’s technical analysis tools, and to refuse to be intimidated by the superficial impression that technical analysis is something for math geniuses, not least the fact that it’s not true.
Take a minute to consider what technical analysis tools can offer you, which is a realistic picture of what trend is shepherding the prices of your currency pair at the moment. Needless to say, this information is invaluable because it helps you set the foundation for your entry position. Technical indicators can also give you an idea of how strong the current trend is, and if it’s likely to stop and reverse. With this insight at your fingertips, you’ll be able to determine your exit points with much more confidence.
In short, technical analysis methods can position you to comprehend the drivers of your currency pair in ways that will prove very helpful. In this article, we’ll open the doors to three categories of technical analysis you can use in your forex trading by talking you through practical examples. Those categories will be candlestick chart patterns, momentum indicators, and Fibonacci trading. If you want to melt that wall of ice that has blocked your way to technical analysis until now, why not join us for a couple of minutes? At iFOREX, we try to warm our clients to every trading concept and tool that gives them the chills.
Kicker Candle
This is a particularly powerful candlestick pattern you can use to pinpoint an abrupt reversal in your currency pair’s trend. You’ll tend to see it on your candlestick charts after a downtrend marked out by a series of descending black candles. The Kicker emerges immediately afterwards, though separated by a gap in the upwards direction, as a long white candle testifying to a bullish revival, in this way:
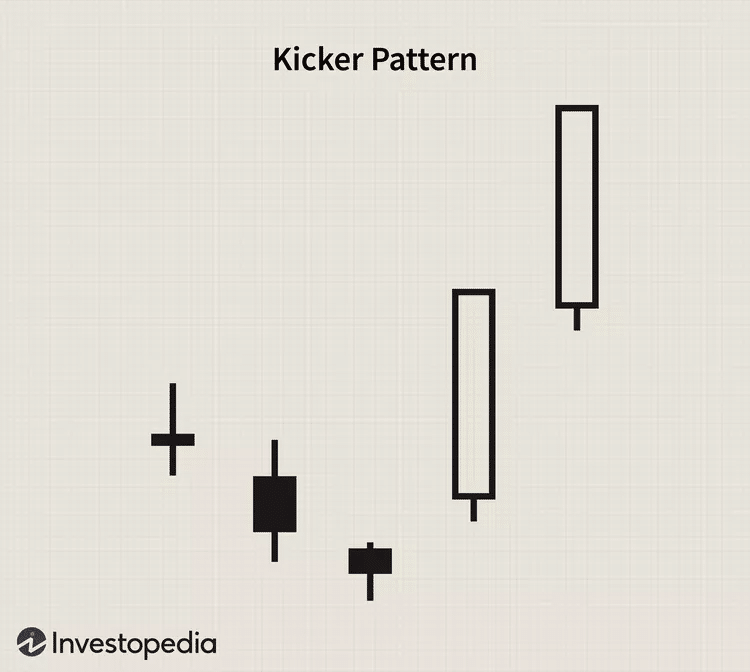
If your volume indicators show more people are trading at the time of the Kicker, you have good reason to believe a brand-new uptrend has just kicked off. The white candle that follows the Kicker confirms your predictions, so you could open your buy deal soon after this candle opens. The Kicker could signal an uptrend that continues even beyond the short term, so prepare yourself to let prices ride for a while if need be. As to an exit point for your trade, this pattern offers you no assistance, so look for a prominent resistance level.
MACD
Your currency pair may be flying high, but how do you know it’s not overbought and due for a fall? Momentum indicators like the MACD tell you the relative speed with which prices are rising. For instance, even if your pair is indeed rising, it could be rising significantly more slowly than it recently was, and this could mean that a downturn is fairly imminent. The way this handy tool works is by comparing two kinds of moving averages for your instrument – one for the last 12 trading sessions and one for the last 26 sessions. When the latter is subtracted from the former, the MACD line can be generated. This is then measured against another line called the signal line, which, at long last, gives you your trading signal. Thank Goodness you won’t have to figure all that out on your own and you can just leave it to your trading app!
Fibonacci Trading
Fibonacci Retracements are a thing of beauty and here’s why: Currency prices move in discernible waves – some big, some small. Normally, a large wave will keep on rolling after drawing back partially, much like a real wave in the sea. This implies that, when prices draw back from a strong trend, it’s most likely they will not do an about-turn and march off in the opposite direction. Rather, they’ll soon continue pushing in the direction of that original trend.
However, before the resumption of that trend commences, there could be several small pullbacks that don’t quite succeed in re-initiating the trend. How can you know that this pullback from the correction is the one that’s going to start the train running again? Use your forex trading app to plot the Fibonacci ratios on your price chart. If your pullback occurs at any of the indicated Fibonacci levels, you’ve got a solid basis to trade in the direction of that trend. To put things slightly differently: trending currency prices tend to correct themselves to the extent indicated by these key percentages. You want to know why? There’s another article out there somewhere that’ll give you a beautiful explanation.
Wrapping Things Up
Appreciating the fundamental drivers of currency prices, like interest rates and economies, is doubtlessly helpful to you in your forex trading endeavours. At the same time, technical analysis methods like the three we’ve mentioned can offer you insights into the market you would not otherwise be able to access. They can make a big difference to you in your struggle to determine ideal entry and exit points, as well as price targets in many cases.
Traders on the iFOREX team are bullish about breaking the barriers separating the amateurs from the professionals. Clients enjoy the use of an extensive education centre that finetunes their understanding of trading concepts and tools on a constant basis. Visit the iFOREX website to find out more.
Related Articles
- Forex vs Crypto: What’s Better For Beginner Traders?
- What Does Binance Being Kicked Out of Belgium Mean for Crypto Prices?
- Crypto Traders and Coin Prices Face New Challenge as Binance Gives up its FCA Licence
- Interpol Declares Investment Scams “Serious and Imminent Threat”
- Annual UK Fraud Audit Reveals Scam Hot-Spots
- Former Schwab, Wells Fargo, and Morgan Stanley Advisor is Sentenced to Seven Years
Forex vs Crypto: What’s Better For Beginner Traders?
What Does Binance Being Kicked Out of Belgium Mean for Crypto Prices?
Safest Forex Brokers 2025
| Broker | Info | Best In | Customer Satisfaction Score | ||
|---|---|---|---|---|---|
| #1 |
|
Global Forex Broker |

BEST SPREADS
Visit broker
|
|
|
| #2 |
|
Globally regulated broker |
BEST CUSTOMER SUPPORT
Visit broker
|
|
|
| #3 |
|
Global CFD Provider |
Best Trading App
Visit broker
|
|
|
| #4 |
|
Global Forex Broker |
Low minimum deposit
Visit broker
|
|
|
| #5 |
|
Global Forex Broker |
Low minimum deposit
Visit broker
|
|
|
| #6 |
|
CFD and Cryptocurrency Broker |
CFD and Cryptocurrency
Visit broker
|
|
|
|
|
|||||

Forex Fraud Certified Brokers

Stay up to date with the latest Forex scam alerts
Sign up to receive our up-to-date broker reviews, new fraud warnings and special offers direct to your inbox