
Market Analysis 21/10 – if you watch one event this week, watch this.
Investors can expect more volatility in the coming days as the likelihood of the US Coronavirus spending bill being passed into law hangs in the balance.
Monday’s sell-off and Tuesday’s rebound in equities mirrored the changing tone from Washington D.C. The Bill is playing on the markets in two-ways.
- Timing – if it is to pass into legislation before the election date of the 3rd of November realistically there is less than 24 hours to find agreement
- Size – Differences of opinion on the size of the spending splurge remain.
Democrat representative and House Speaker, Nancy Pelosi and Republican Treasury Secretary Steven Mnuchin have been leading the talks.
On Tuesday the White House Chief of Staff Mark Meadows said that the pair had made “good progress”, before adding that they “still have a ways to go” before an agreement is reached.
The ongoing talks are set to dominate the market. The previous week’s sideways trading in major indices representing a contraction in volatility as market participants brace themselves for a significant move in one direction or another.
Anyone trading the markets will find opportunity and risk in equal measure. The good thing with CFD trading is that you can sell short as well as go long and profit from markets moving in both directions.
While it must be emphasised that the reaction to the spending bill cannot be predicted, the price action in the S&P 500 hourly chart has formed a downward channel.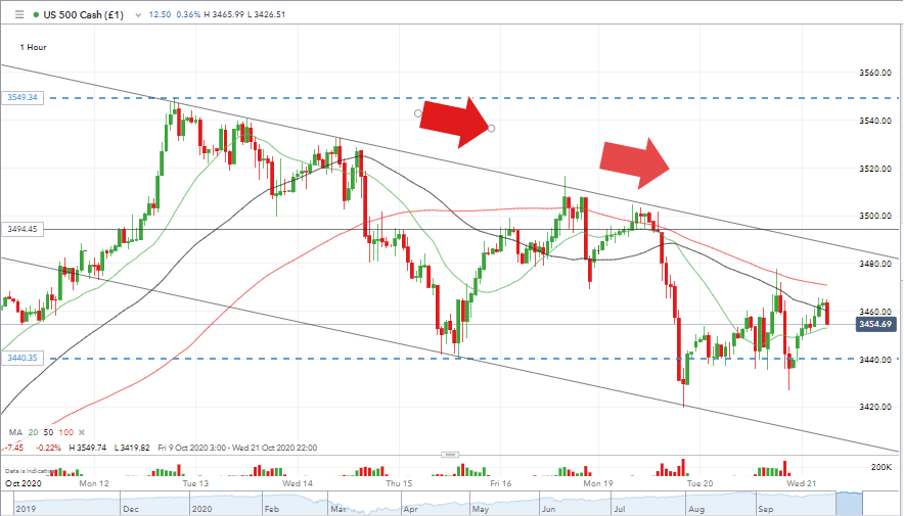
Source: IG
The world’s flagship equity index is still trading above its Daily SMAs
- 20 SMA – 3437
- 50 SMA – 3410
- 100 SMA – 3334`
The last significant sell-off, the 10.56% drop in September, bottomed out when price hit the weekly 20 SMA at 3205.
That same weekly SMA has since risen to 3295, making the 3,300 level an area on the chart which is full of various support levels.
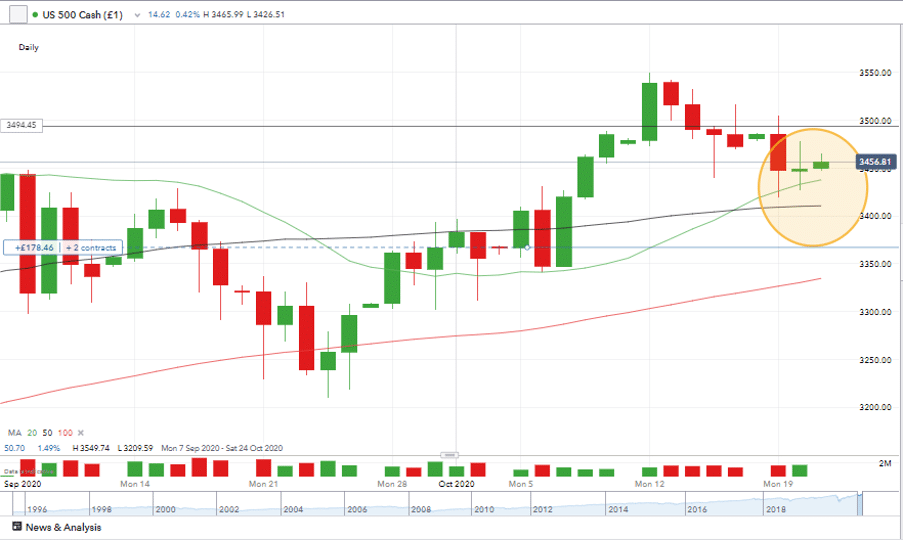
Source: IG
The narrowing of the Bollinger bands does indicate we’re entering the quiet before the storm. It doesn’t necessarily mean that the break out will be to the downside. It could be argued the downward channel on the hourly chart points towards investors being nervous rather than panicked.
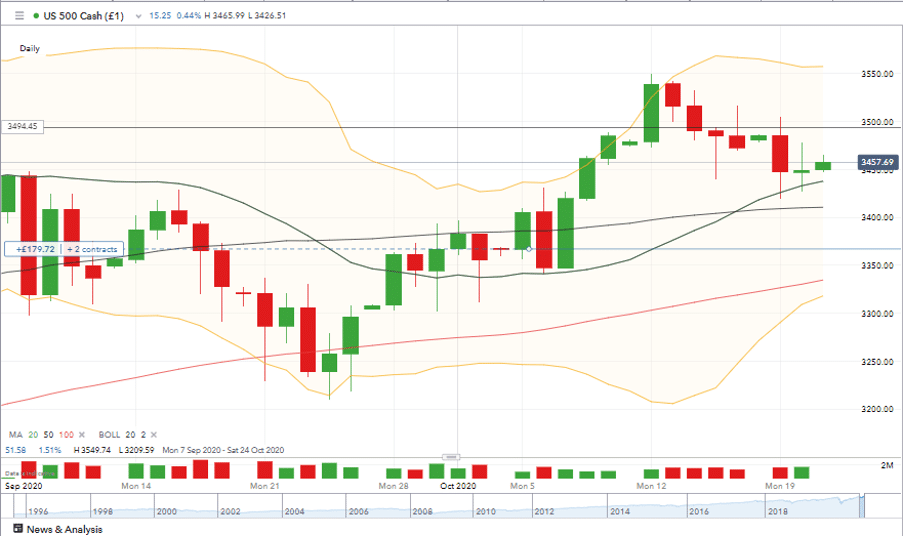
Source: IG
Resistance to the upside comes in the form of previous highs. The fact that price is trading above the 20,30 and 50 SMA’s on a Daily, Weekly and Monthly time-frame tells its own story about how the market is pricing in any further upside.
Monthly High Oct: 3549.74
Monthly High Sep: 3588.49
All-Time High (Sep): 3588.49
Speaking late on Tuesday, Meadows gave an outline on how talks might impact the week’s trading. He said:
“I would think that those discussions hopefully would make progress again tomorrow and perhaps the following day.” He added that he hopes to see “some kind of agreement before the weekend.”
There is no doubt that this is the major news event of the week. The situation may have moved on from “will they won’t they” but is still stuck at “when will they” and “how much will they”. When those answers are finally delivered, expect a significant market reaction.
Our analysis is based on a comprehensive summary of market data. We use a range of metrics with weighting given to simple and exponential moving averages and key technical indicators. Any information contained on this Website is provided as general market information for educational and entertainment purposes only, and does not constitute investment advice. The Website should not be relied upon as a substitute for extensive independent market research before making your actual trading decisions. Opinions, market data, recommendations or any other content is subject to change at any time without notice. ForexFraud will not accept liability for any loss or damage, including without limitation any loss of profit, which may arise directly or indirectly from use of or reliance on such information.
PAST PERFORMANCE IS NOT NECESSARILY INDICATIVE OF FUTURE RESULTS.
Related Articles
- Forex vs Crypto: What’s Better For Beginner Traders?
- Three Great Technical Analysis Tools for Forex Trading
- What Does Binance Being Kicked Out of Belgium Mean for Crypto Prices?
- Crypto Traders and Coin Prices Face New Challenge as Binance Gives up its FCA Licence
- Interpol Declares Investment Scams “Serious and Imminent Threat”
- Annual UK Fraud Audit Reveals Scam Hot-Spots
Forex vs Crypto: What’s Better For Beginner Traders?
Three Great Technical Analysis Tools for Forex Trading
Safest Forex Brokers 2024
| Broker | Info | Best In | Customer Satisfaction Score | ||
|---|---|---|---|---|---|
| #1 |
|
Global Forex Broker |

BEST SPREADS
Visit broker
|
|
|
| #2 |
|
Globally regulated broker |
BEST CUSTOMER SUPPORT
Visit broker
|
|
|
| #3 |
|
Global CFD Provider |
Best Trading App
Visit broker
|
|
|
| #4 |
|
Global Forex Broker |
Low minimum deposit
Visit broker
|
|
|
| #5 |
|
Global CFD & FX Broker |
ALL-INCLUSIVE TRADING PLATFORM
Visit broker
|
|
|
| #6 |
|
Global Forex Broker |
Low minimum deposit
Visit broker
|
|
|
| #7 |
|
CFD and Cryptocurrency Broker |
CFD and Cryptocurrency
Visit broker
|
|
|
|
|
|||||

Forex Fraud Certified Brokers

Stay up to date with the latest Forex scam alerts
Sign up to receive our up-to-date broker reviews, new fraud warnings and special offers direct to your inbox