
Wednesday the 24th February
Someone that is checking market prices once a day might be lulled into thinking that not much is going on at the moment. Intraday price volatility is, however, picking up with equity futures on Tuesday suffering a dramatic crash followed by a wild comeback.
Tuesday US equity markets – The tale of the tape
- US30 (DJIA) and S&P 500 recovered from sharp losses to finish modestly higher. The positive finish snapped a five-day skid for the S&P 500.
- Nasdaq Composite index, intraday down more than 3.75% but finished the session posting a loss of just 0.5%.
US30 Price Chart – M30
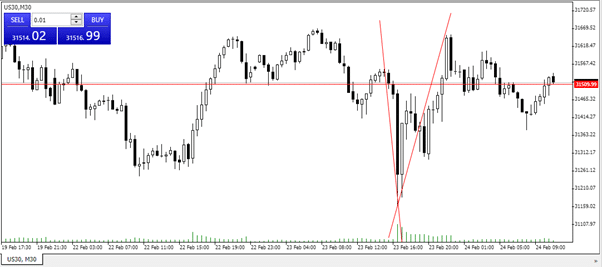
Source: Tickmill
NAS100 Price Chart – M30
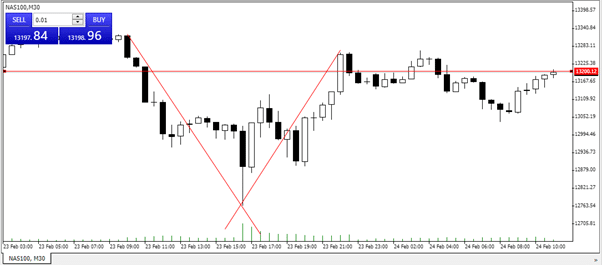
Source: Tickmill
CBOE VIX Index as an Indicator
At the same time, the CBOE VIX index, which measures fear in the markets, has remained little changed. Its intraday price rise of 0.69% not reflecting wholly the change in mood as much as the temporary price spike to >28.00 at 8 a.m. (ET)
The VIX measures the implied volatility of the S&P500 (SPX) index. It aggregates data relating to the price of SPX options, so when the VIX is up, it means there are significant and rapid price fluctuations in the S&P 500 index itself.
The divergence between SPX price moves and VIX price changes may be the sign of a more profound disconnect or just lagging. It will be something worth watching.
CBOE VIX index – monthly chart
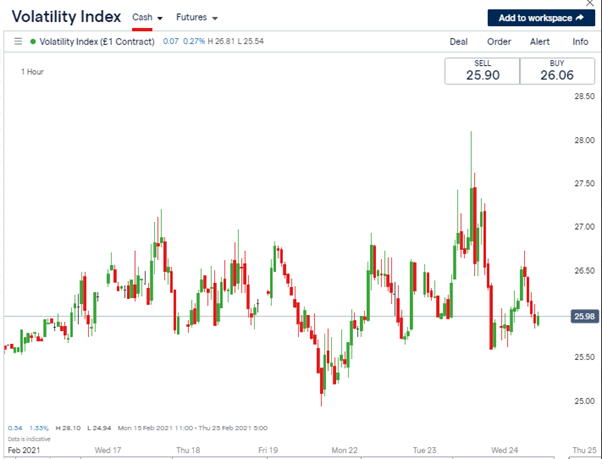
Source: IG
Tuesday’s events highlight how bulls and bears are currently operating on different timeframes. Market sentiment pointed to a short-term pullback for the bears, but the bulls are taking comfort from the overall set-up for stocks remaining positive.
Short-term Downward Pressure on Stocks
Since the 15th of February, the stock market bears with nagging doubts about the recovery rate have been driving down the price of the S&P500 (SPX). The hourly price chart illustrates a downward trading channel and an uptick in trading volumes on Tuesday.
S&P500 SPX Price Chart – 1H
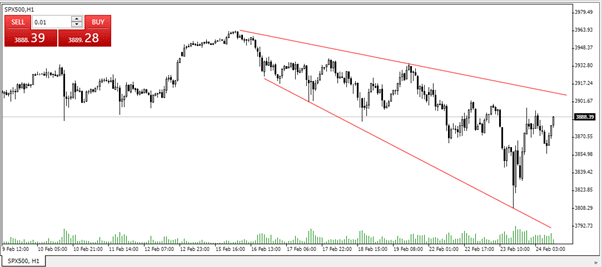
Source: Tickmill
Technical Indicators on a Longer Time-scale are More Bullish
The daily price chart tells a different story and might explain bulls’ willingness to rush into the market during Tuesday’s sell-off. The SPX price is nearing the support line of an almost year-long upward price channel.
S&P500 SPX Price Chart – 1D
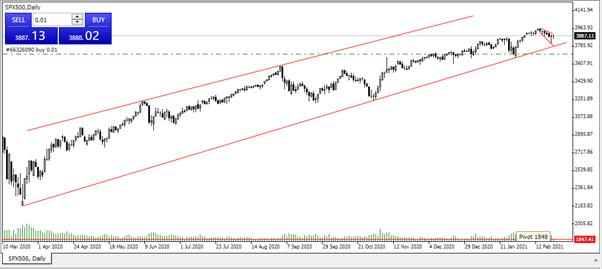
Source: Tickmill
Time will tell if yesterday’s events marked a spectacular dip-buying opportunity. The trendline support of the SPX currently sits at 3785. With the hourly chart being bearish, those with enough patience will be waiting for price to fall a further 2.5% before entering into long positions.
Bulls Also Look to Fundamentals
The rebound started after an intervention by US Federal Reserve Chair Jerome Powell. He released a prepared statement to the Senate Banking Committee and the remarks were the tonic the markets needed. The central bank chief said that inflation was “soft” and that the US economy was “a long way from our employment and inflation goals.”
Powell’s pep-talk might continue into Wednesday with the Chair due to visit Capitol Hill and address the House of Representatives Financial Services Committee. Given the reaction to yesterday’s statement, all eyes will be on that event and it explains the muted opening to the European trading session.
If you want to know more about this topic or have been scammed by a fraudulent broker, please contact us at [email protected]
Related Articles
- Forex vs Crypto: What’s Better For Beginner Traders?
- Three Great Technical Analysis Tools for Forex Trading
- What Does Binance Being Kicked Out of Belgium Mean for Crypto Prices?
- Crypto Traders and Coin Prices Face New Challenge as Binance Gives up its FCA Licence
- Interpol Declares Investment Scams “Serious and Imminent Threat”
- Annual UK Fraud Audit Reveals Scam Hot-Spots
Forex vs Crypto: What’s Better For Beginner Traders?
Three Great Technical Analysis Tools for Forex Trading
Safest Forex Brokers 2025
| Broker | Info | Best In | Customer Satisfaction Score | ||
|---|---|---|---|---|---|
| #1 |
|
Global Forex Broker |

BEST SPREADS
Visit broker
|
|
|
| #2 |
|
Globally regulated broker |
BEST CUSTOMER SUPPORT
Visit broker
|
|
|
| #3 |
|
Global CFD Provider |
Best Trading App
Visit broker
|
|
|
| #4 |
|
Global Forex Broker |
Low minimum deposit
Visit broker
|
|
|
| #5 |
|
Global Forex Broker |
Low minimum deposit
Visit broker
|
|
|
| #6 |
|
CFD and Cryptocurrency Broker |
CFD and Cryptocurrency
Visit broker
|
|
|
|
|
|||||

Forex Fraud Certified Brokers

Stay up to date with the latest Forex scam alerts
Sign up to receive our up-to-date broker reviews, new fraud warnings and special offers direct to your inbox