
Dollar-yen may have lower price volatility than some other currency pairs, but it’s recently been moving into the spotlight by making substantial price moves. The total change in values may not be as dramatic as Kiwi or Aussie, but the momentum’s consistency is turning heads at the moment.
USDJPY – H4 price chart – price consolidation?
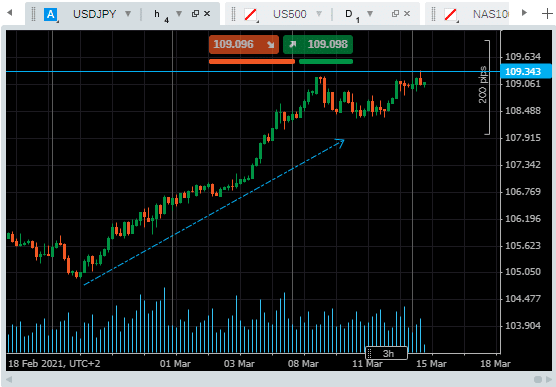
Source: Pepperstone
The move from below 105 to 109.35 in the space of two-weeks has taken place without a pick-up in trade volumes. The weekly chart shows trade volume levels holding constant. This isn’t the whip-sawing seen around the 24th of February when price recalibrated and trading volumes more than doubled. Instead, the 400-point move looks like a deliberate if relatively fast-paced change in market opinion.
USDJPY – Weekly price chart
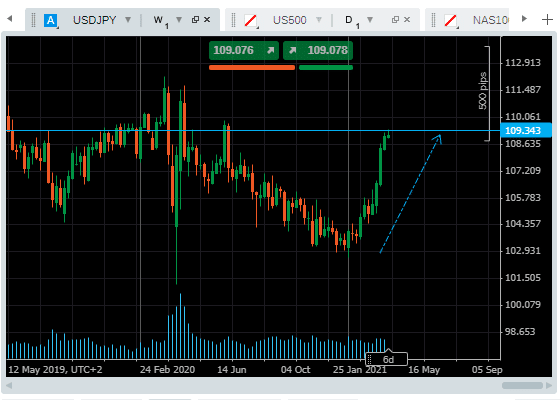
Source: Pepperstone
The new resistance at the 109.35 level looks set to become a crucial indicator. A break to the upside and the first rally’s strength could lead to any sellers in the market bailing out of positions as soon as they can.
A break of the supporting trend line and the two-week move could be filed under ‘just another short-term retracement forming part of the US dollar’s long-term price decline’.
USDJPY – H4 price chart – supporting trend line
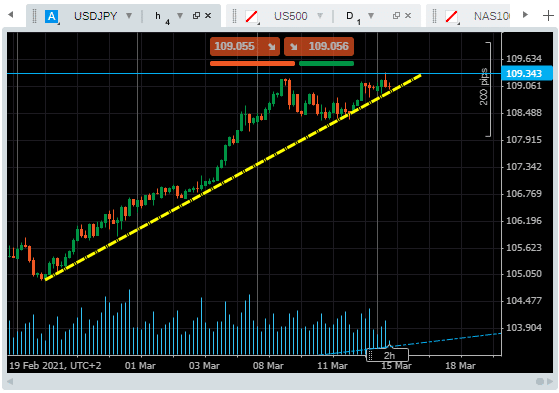
Source: Pepperstone
Major news announcements are due out of the US and Japan this week, with the central bank interest rate announcements being the ones to watch.
- Wednesday the 17th of March – US Fed – interest rate decision
- Friday the 19th of March – Bank of Japan – interest rate decision
More economic data from both economies will pepper the trading week.
- Monday the 15th of March – NY Empire State Manufacturing index
- Tuesday the 16th of March – US: Retail sales, import and export prices, NAHB house price index and industrial production
- Wednesday the 17th of March – Japan: Trade balance and US crude inventories
- Thursday the 18th of March – US: initial jobless claims, Q1 earnings from Nike and Fed Ex.
- Friday the 19th of March – Japan: February inflation report, US Baker Hughes oil-rig count.
The wedge pattern formed by the resistance at 109.35 and the supporting trend line is interesting because it looks like price is set to reach the funnel’s end before the news is released. The point of the pattern is sitting near the end of Tuesday’s trading session, while the US Fed announcement isn’t due until later Wednesday and the news from Tokyo not due until Friday.
That could lead to price action suggesting the upward or downward move has been confirmed when in reality, the movers and shakers in the market are waiting for the announcements from the Fed and the BoJ before making their call.
USDJPY – H1 price chart – wedge pattern forming
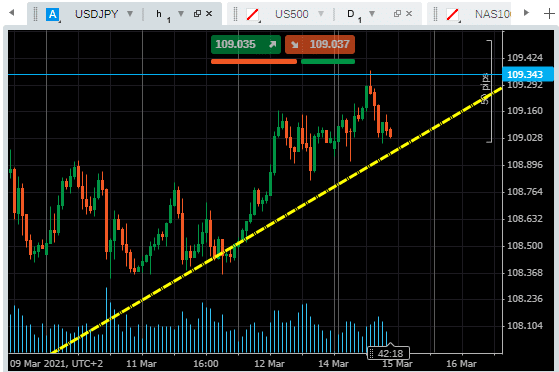
Source: Pepperstone
A false-break based solely on technical analysis could catch some out. The price of USDJPY looks more likely to follow the fundamental analysis news that is due from the central banks. Even if it’s not traded, the situation is one to watch. If this is the end of a 12-month price slide for the dollar, there will be severe ramifications for all asset groups.
USD Basket index – Weekly Price Chart
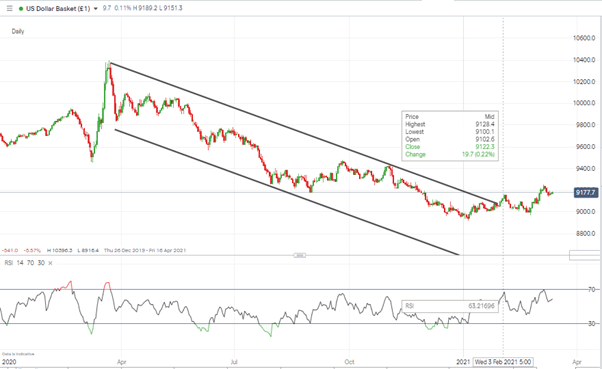
Source: IG
If you want to know more about this topic, or have been scammed by a fraudulent broker, please contact us at [email protected]
Related Articles
- Forex vs Crypto: What’s Better For Beginner Traders?
- Three Great Technical Analysis Tools for Forex Trading
- What Does Binance Being Kicked Out of Belgium Mean for Crypto Prices?
- Crypto Traders and Coin Prices Face New Challenge as Binance Gives up its FCA Licence
- Interpol Declares Investment Scams “Serious and Imminent Threat”
- Annual UK Fraud Audit Reveals Scam Hot-Spots
Forex vs Crypto: What’s Better For Beginner Traders?
Three Great Technical Analysis Tools for Forex Trading
Safest Forex Brokers 2025
| Broker | Info | Best In | Customer Satisfaction Score | ||
|---|---|---|---|---|---|
| #1 |
|
Global Forex Broker |

BEST SPREADS
Visit broker
|
|
|
| #2 |
|
Globally regulated broker |
BEST CUSTOMER SUPPORT
Visit broker
|
|
|
| #3 |
|
Global CFD Provider |
Best Trading App
Visit broker
|
|
|
| #4 |
|
Global Forex Broker |
Low minimum deposit
Visit broker
|
|
|
| #5 |
|
Global Forex Broker |
Low minimum deposit
Visit broker
|
|
|
| #6 |
|
CFD and Cryptocurrency Broker |
CFD and Cryptocurrency
Visit broker
|
|
|
|
|
|||||

Forex Fraud Certified Brokers

Stay up to date with the latest Forex scam alerts
Sign up to receive our up-to-date broker reviews, new fraud warnings and special offers direct to your inbox