
After weeks of continuous downward pressure, risk-on assets have spent most of this week consolidating at lower levels and posting some positive returns. Is the worst over, or is this just a dead-cat bounce? The Forex Fraud analysts have pulled out key technical analysis metrics to shed light on the possible moves from here.
Equity Markets Were Oversold and Testing a Key SMA Support Level
Using the Relative Strength Index (RSI), there were signs that markets were oversold on certain time frames at the start of the week. Oversold conditions can, of course, persist for a long time, which means triggering that indicator doesn’t always equate to a price rally being around the corner. Still, in this instance, it appears to have played out accurately.
FTSE 100 Daily Price Chart Sep 2021 – March 2022 –Market Rally Off RSI Oversold Indicator
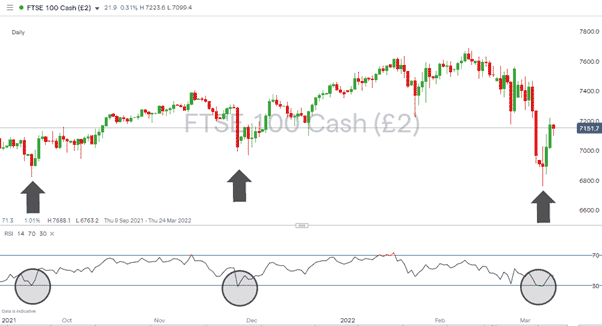
Source: IG
The FTSE 100 index price chart set to a Daily timeframe clipped the 30 RSI in September and November 2021, and in both instances, that marked the start of a significant price rally. On Monday 7th February, the Daily RSI reached as low as 28.9 before the index then shot up by 6.19% in the space of two trading sessions.
20 SMA on Monthly Price Chart
S&P 500 Monthly Price Chart – Bounces off 20 SMA
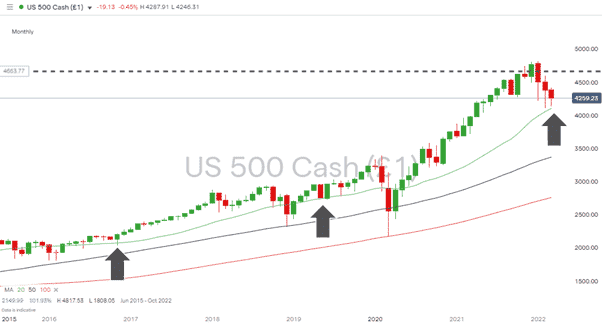
Source: IG
The bounce earlier in the week in the S&P 500 equity index illustrates the role of another useful metric when spotting oversold markets – the 20 SMA on a Monthly time frame. Whilst the Monthly 20 SMA doesn’t always hold, it did in November 2016 and May 2019, and so far, it looks like it did again earlier this week.
Traders who held their nerve and ran disciplined strategies may have just missed out on entering trades as the SMA is sitting at 4,104, and price only got as low as 4,141 – an excellent example of why it’s a good idea to consider averaging into positions.
How Far Will The Rally Go?
The role of oil and gas need to be factored into any projections considering if risk-on assets will continue rising from here.
During the Ukraine-Russia crisis, concerns about the supply of both energy commodities have been a significant driver of prices in other markets. There’s been a genuine risk that soaring prices would substantially impact other sectors of the economy.
Brent Crude Oil Daily Price Chart – Support from 20 SMA
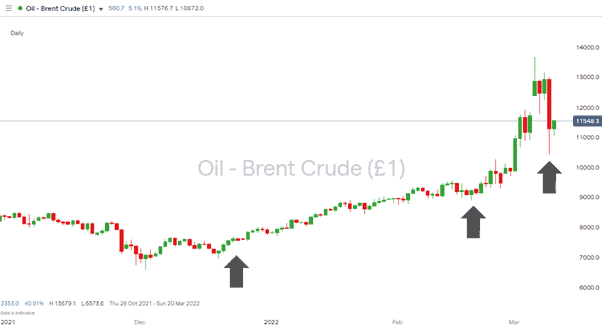
Source: IG
Using the Daily 20 SMA for Brent Crude, one interesting indication of price support is the touch of that key metric on Wednesday, 9th February. Price then bounced from there, and the 20 Daily SMA for oil now sits at $105.54 per barrel. Given that SMA has supported price since December 2021, it would appear there’s still plenty of room for further upward moves in oil prices and corresponding downwards moves in risk-on assets.
Crowdsourcing information about scam brokers can help others avoid falling into the traps set by disreputable brokers and you can share your experiences here. If you want to know more about this particular topic, or have been scammed by a fraudulent broker, you can also contact us at [email protected]
Related Articles
- Forex vs Crypto: What’s Better For Beginner Traders?
- Three Great Technical Analysis Tools for Forex Trading
- What Does Binance Being Kicked Out of Belgium Mean for Crypto Prices?
- Crypto Traders and Coin Prices Face New Challenge as Binance Gives up its FCA Licence
- Interpol Declares Investment Scams “Serious and Imminent Threat”
- Annual UK Fraud Audit Reveals Scam Hot-Spots
Forex vs Crypto: What’s Better For Beginner Traders?
Three Great Technical Analysis Tools for Forex Trading
Safest Forex Brokers 2024
| Broker | Info | Best In | Customer Satisfaction Score | ||
|---|---|---|---|---|---|
| #1 |
|
Global Forex Broker |

BEST SPREADS
Visit broker
|
|
|
| #2 |
|
Globally regulated broker |
BEST CUSTOMER SUPPORT
Visit broker
|
|
|
| #3 |
|
Global CFD Provider |
Best Trading App
Visit broker
|
|
|
| #4 |
|
Global Forex Broker |
Low minimum deposit
Visit broker
|
|
|
| #5 |
|
Global CFD & FX Broker |
ALL-INCLUSIVE TRADING PLATFORM
Visit broker
|
|
|
| #6 |
|
Global Forex Broker |
Low minimum deposit
Visit broker
|
|
|
| #7 |
|
CFD and Cryptocurrency Broker |
CFD and Cryptocurrency
Visit broker
|
|
|
|
|
|||||

Forex Fraud Certified Brokers

Stay up to date with the latest Forex scam alerts
Sign up to receive our up-to-date broker reviews, new fraud warnings and special offers direct to your inbox