The weekly doji candles on the S&P 500 equity index highlight how traders have been holding back in anticipation of the US presidential vote. With that result now just days, rather than weeks away, there is a sense that something has got to give.

Preparing for that move involves balancing up risk and opportunity but some classic doji based trading strategies could help bring order where there is chaos.
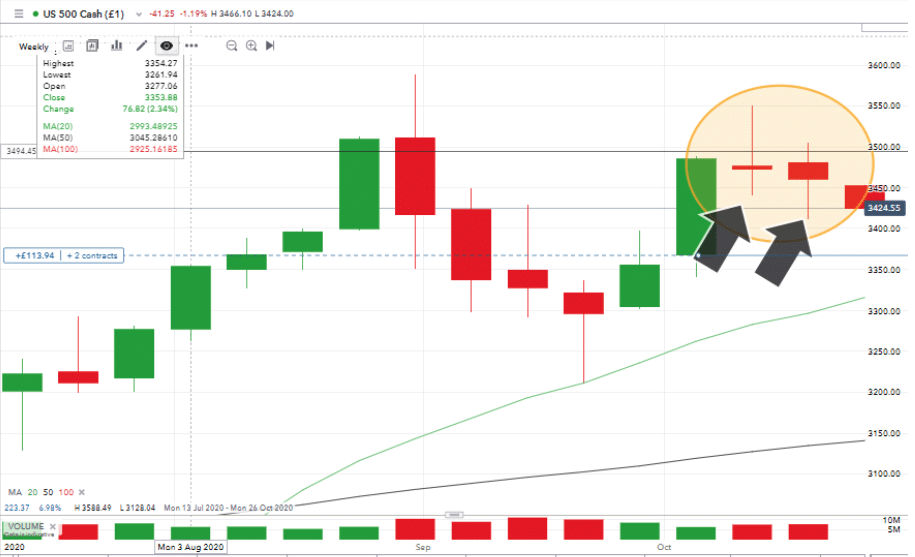
Source: IG
Price action in the world’s flagship index is forming a descending triangle pattern. Monday’s open of European markets has seen equity prices there continue. The scale of the move suggests that a break out to the downside could have legs. The price of the S&P 500 is less than 3% off its mid-October highs and the RSI of 59 suggests the market is far from over-sold.
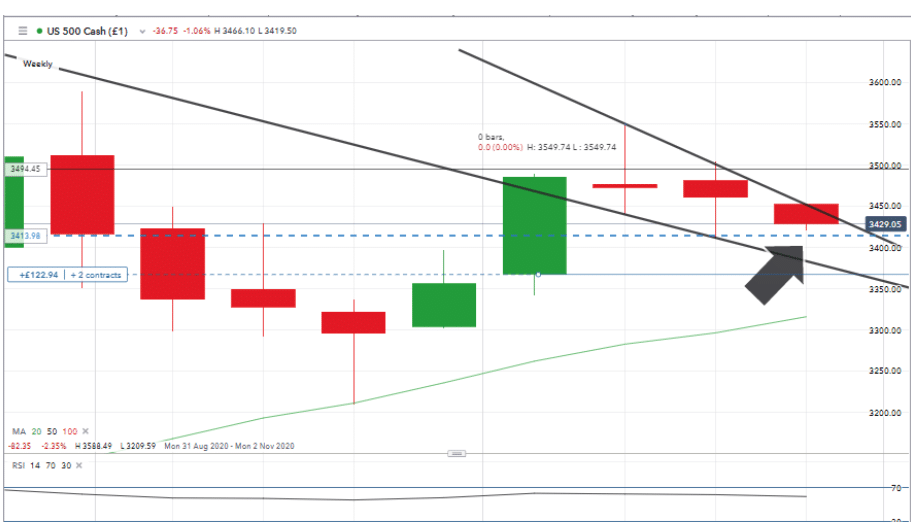
Source: IG
Support levels include last week’s low of 3410, the supporting trend line which is currently at 3386 and the Weekly 20 SMA at 3316.
One of the critical factors to take on board is that the ‘noise’ rather than the result is the driver of markets. Opinion is somewhat divided on whether Trump or Biden would be a better president for the economy. Whichever candidate wins, the markets may settle down relatively quickly. The left-leaning policies of Bernie Saunders and Elizabeth Warren were taken off the table earlier in the year.
The US election may already be ‘over’ for some analysts. But if the pollsters are wrong, again, the political landscape will be flipped dramatically.
Opinion polling has seen its reputation tarnished by recent incorrect calls. Pollsters are tipping a Biden win in the US presidential race and say, ‘this time it’s different’. That means, statistically speaking, that a shock Trump win is less likely than when they got it wrong last time.
Betting companies which approach the situation from a different angle can be more reliable indicators. They are, after all dealing with hard cash rather than theoretical ideas and having skin in the game can focus the mind.
US citizens are banned from political betting; however, UK betting firms reported over the weekend that just under 65% of all wagers placed on the 2020 US election this weekend were on a Donald Trump victory. Only 31.7% of bets placed backed Joe Biden.
The pollsters are so far sticking with their position. They state that with approximately one-third of all anticipated votes already submitted using ‘vote-in’ schemes there appears to be little room for the incumbent to change the situation.
Potential for upward movement in equities looks reliant on the corporate earnings announcements due this week. Some of the biggest and most important firms are due to release data, including AAPL, AMZN, CVX, FB, GOOGL, MSFT, XOM.
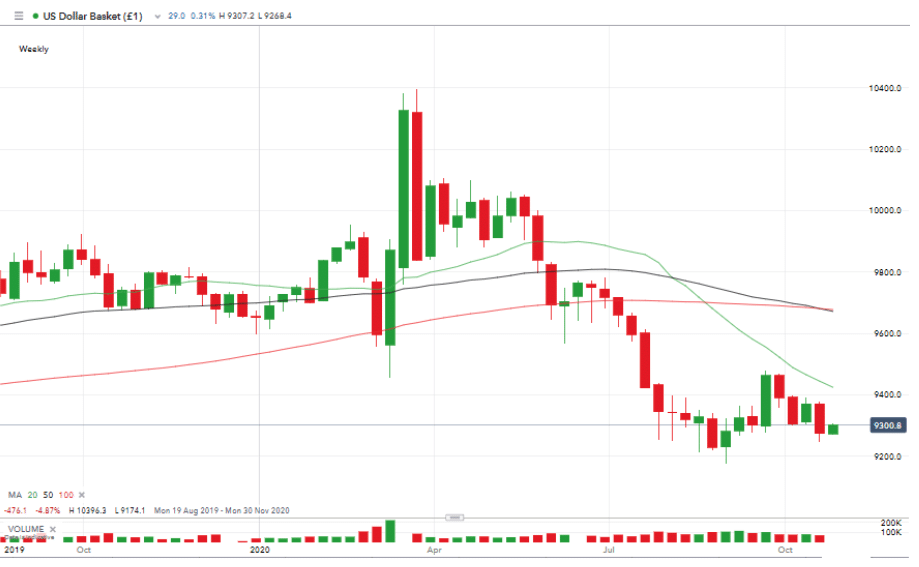
Source: IG
An interesting feature of current markets is that the US Dollar has weakened at the same time as equity markets have sold off. The forex move should reflect risk appetite increasing, but the equity move suggests the risk is being taken off.
That raises the question of where did that money go? A disconnect between different markets can only be resolved by one of them reversing their direction. The noise from the election campaigns could easily be a sufficient catalyst for that move to take place.
Our analysis is based on a comprehensive summary of market data. We use a range of metrics with weighting given to simple and exponential moving averages and key technical indicators.
Risk Statement: Trading Financial Markets on margin carries a high level of risk and may not be suitable for all investors. The possibility exists that you could lose more than your initial deposit. The high degree of leverage can work against you as well as for you.
Any opinions, chats, messages, news, research, analyses, prices, or other information contained on this Website are provided as general market information for educational and entertainment purposes only and do not constitute investment advice. The Website should not be relied upon as a substitute for extensive independent market research before making your actual trading decisions. Opinions, market data, recommendations or any other content is subject to change at any time without notice. TradingView, Inc. will not accept liability for any loss or damage, including without limitation any loss of profit, which may arise directly or indirectly from use of or reliance on such information.
We do not recommend the use of technical analysis as a sole means of trading decisions. We do not recommend making hurried trading decisions. You should always understand that PAST PERFORMANCE IS NOT NECESSARILY INDICATIVE OF FUTURE RESULTS.
Any information contained on this Website is provided as general market information for educational and entertainment purposes only, and does not constitute investment advice. The Website should not be relied upon as a substitute for extensive independent market research before making your actual trading decisions. Opinions, market data, recommendations or any other content is subject to change at any time without notice. ForexTraders will not accept liability for any loss or damage, including without limitation any loss of profit, which may arise directly or indirectly from use of or reliance on such information.
PAST PERFORMANCE IS NOT NECESSARILY INDICATIVE OF FUTURE RESULTS.
Related Articles
- Forex vs Crypto: What’s Better For Beginner Traders?
- Three Great Technical Analysis Tools for Forex Trading
- What Does Binance Being Kicked Out of Belgium Mean for Crypto Prices?
- Crypto Traders and Coin Prices Face New Challenge as Binance Gives up its FCA Licence
- Interpol Declares Investment Scams “Serious and Imminent Threat”
- Annual UK Fraud Audit Reveals Scam Hot-Spots
Forex vs Crypto: What’s Better For Beginner Traders?
Three Great Technical Analysis Tools for Forex Trading
Safest Forex Brokers 2025
| Broker | Info | Best In | Customer Satisfaction Score | ||
|---|---|---|---|---|---|
| #1 |
|
Global Forex Broker |

BEST SPREADS
Visit broker
|
|
|
| #2 |
|
Globally regulated broker |
BEST CUSTOMER SUPPORT
Visit broker
|
|
|
| #3 |
|
Global CFD Provider |
Best Trading App
Visit broker
|
|
|
| #4 |
|
Global Forex Broker |
Low minimum deposit
Visit broker
|
|
|
| #5 |
|
Global Forex Broker |
Low minimum deposit
Visit broker
|
|
|
| #6 |
|
CFD and Cryptocurrency Broker |
CFD and Cryptocurrency
Visit broker
|
|
|
|
|
|||||

Forex Fraud Certified Brokers

Stay up to date with the latest Forex scam alerts
Sign up to receive our up-to-date broker reviews, new fraud warnings and special offers direct to your inbox