The Canadian Loon is known to be an excellent swimmer, but when it comes to flying, the bulkiness of the poor bird often makes taking off rather difficult. In many more ways than you might expect, the Loonie, the affectionate nickname of the Canadian one-dollar coin, also resembles its namesake whenever it attempts to fly high versus the mighty U.S. Dollar. In February, it mounted one of its best attempts to fly back to parity, but it soon succumbed in July, like most all other majors, when “King Dollar” reappeared.
It was nearly two years back in early 2013 when the Loonie was wrested away from parity with the greenback. That period of strength had lasted for some three years, a repeat of the behavior back in late 2007 through 2008, but, from a long-term perspective since 2000, the average valuation for the Loonie has actually been roughly 1.32, a good bit removed from today’s value of 1.13. The reason for its more recent above-average performance, as we learned in early forex training, is that the CAD is inextricably tied to the oil market.
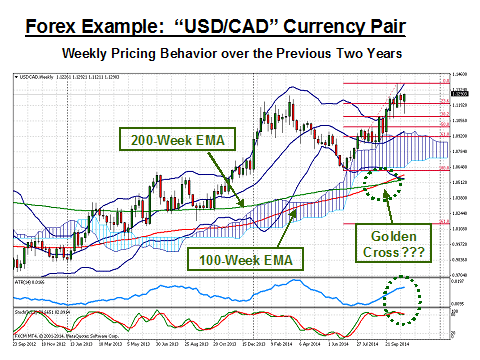
Canada is the second leading oil producer, well behind Saudi Arabia, but “Number Two” just the same. The USD peaked out versus the CAD, so to speak, in January of 2002 at 1.62, a fact worth remembering when assessing today’s pricing behavior. The question now is whether the Loonie can muster another charge or slink back to lower ground? Let’s start with the following chart to arrive at some clues to the answer:
The march of the U.S. Dollar has been slow and gradual, with an occasional bump along the way. These so-called “bumps” have been more pronounced of late, an indication of the uncertainty in the global economy and its demand for oil and related energy products. Much has been written about the 20% fall in oil prices in September, but a bottom of $80/barrel of WTI crude seems to have formed during October. There has been much conjecture as to why oil has fallen so precipitously. The leading opinions are detailed below:
- U.S. producers are producing more oil than ever before in history, and it shows in a glut of supply and a lessening dependence on foreign oil imports;
- Saudi Arabia is deliberately forcing OPEC prices to fall to levels that will be unprofitable for western refineries, thereby creating a cutback in production, falling supply, and a return to higher prices;
- U.S. producers, however, have been accumulating parcels of land in abundance, such that land costs going forward will decline and counter Arab strategies;
- Drilling technology has greatly improved efficiencies and output on existing, as well as on future drilling projects;
- According to one expert, “For the first time ever, the North American oil industry has a high certainty of how much oil they can produce for the next 20-30 years… the Saudis need to see oil under $60/barrel to really inflict pain on North American producers.”
The Canadian Dollar is more appropriately correlated to what is called the “West Canada Select” index, not the more common news flashes for WTI crude or Brent oil. While most indexes have declined nearly 20%, the CAD depreciated some 6%. Is more depreciation in the cards? The indicators in the chart look favorable, but the “Golden Cross”, formed by the two long-term EMAs, seems to suggest otherwise, especially when you accept that current valuations have a good ways to go to hit the 1.32 average from above.
“So goes oil, so goes the Loonie” is a time-honored mantra for good reason. Look for more depreciation.
Related Articles
- Forex vs Crypto: What’s Better For Beginner Traders?
- Three Great Technical Analysis Tools for Forex Trading
- What Does Binance Being Kicked Out of Belgium Mean for Crypto Prices?
- Crypto Traders and Coin Prices Face New Challenge as Binance Gives up its FCA Licence
- Interpol Declares Investment Scams “Serious and Imminent Threat”
- Annual UK Fraud Audit Reveals Scam Hot-Spots
Forex vs Crypto: What’s Better For Beginner Traders?
Three Great Technical Analysis Tools for Forex Trading
Safest Forex Brokers 2025
| Broker | Info | Best In | Customer Satisfaction Score | ||
|---|---|---|---|---|---|
| #1 |
|
Global Forex Broker |

BEST SPREADS
Visit broker
|
|
|
| #2 |
|
Globally regulated broker |
BEST CUSTOMER SUPPORT
Visit broker
|
|
|
| #3 |
|
Global CFD Provider |
Best Trading App
Visit broker
|
|
|
| #4 |
|
Global Forex Broker |
Low minimum deposit
Visit broker
|
|
|
| #5 |
|
Global CFD & FX Broker (*Don’t invest unless you’re prepared to lose all the money you invest. This is a high-risk investment and you should not expect to be protected if something goes wrong. Take 2 mins to learn more) |
ALL-INCLUSIVE TRADING PLATFORM
Visit broker
|
|
|
| #6 |
|
Global Forex Broker |
Low minimum deposit
Visit broker
|
|
|
| #7 |
|
CFD and Cryptocurrency Broker |
CFD and Cryptocurrency
Visit broker
|
|
|
|
|
|||||

Forex Fraud Certified Brokers

Stay up to date with the latest Forex scam alerts
Sign up to receive our up-to-date broker reviews, new fraud warnings and special offers direct to your inbox