
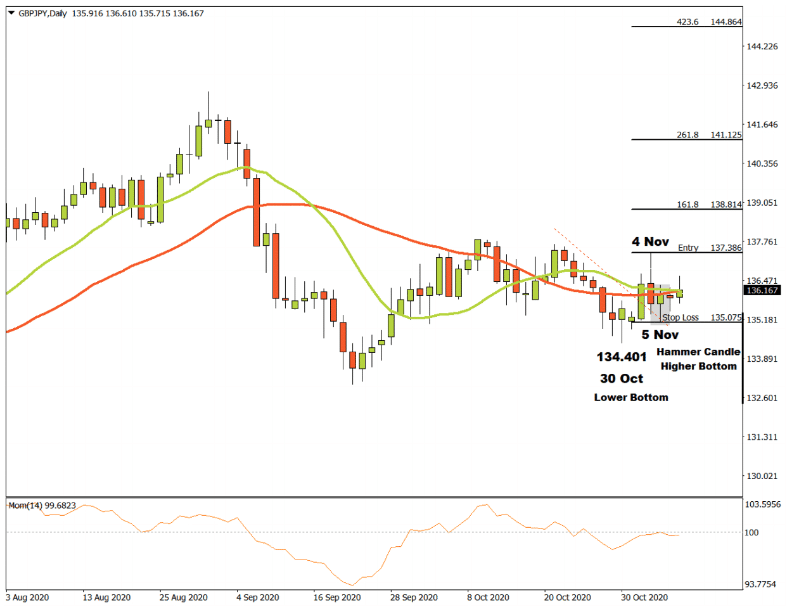
Following a short downtrend structure that started forming on the GBPJPY Daily chart, it seems like the Bears might be running out of steam. On the 30th of October, a lower bottom formed at 134.401 but the downward momentum could not be sustained. The currency pair then broke through the 15 and 34 Simple Moving Averages with the Momentum Oscillator briefly touching the 100 baseline that divides the positive and negative territories.
The upward momentum continued until it hit a possible critical resistance level at 137.386 on the 4th of November. The Bears then tried their best to regain control but a support level was formed the next day at 135.075 with a Hammer Candles pattern and a resulting possible higher bottom completed. This is the first indication for technical traders of a possible change in trend from consecutively lower tops and bottoms to consecutively higher tops and bottoms.
If the GBPJPY breaks through the critical resistance level at 137.386, then three possible price targets can be calculated from there. Applying the Fibonacci tool to the top of the resistance level at 137.386 and dragging it to the conformed support level at 135.075, the following targets may be considered. The first target can be estimated at 138.814 (161 %). The second price target may be considered at 141.125 (261.8%), and the third and final target could be projected at 144.864 (423.6%).
If the established 135.075 support level is broken, the anticipated price targets above are annulled and the whole scenario must be re-evaluated.
As long as the GBPJPY price structure continues to make higher tops and bottoms, the outlook for the currency pair on the Daily time-frame will remain bullish.
For more information, please visit: FXTM
Related Articles
- Forex vs Crypto: What’s Better For Beginner Traders?
- Three Great Technical Analysis Tools for Forex Trading
- What Does Binance Being Kicked Out of Belgium Mean for Crypto Prices?
- Crypto Traders and Coin Prices Face New Challenge as Binance Gives up its FCA Licence
- Interpol Declares Investment Scams “Serious and Imminent Threat”
- Annual UK Fraud Audit Reveals Scam Hot-Spots
Forex vs Crypto: What’s Better For Beginner Traders?
Three Great Technical Analysis Tools for Forex Trading
Safest Forex Brokers 2024
| Broker | Info | Best In | Customer Satisfaction Score | ||
|---|---|---|---|---|---|
| #1 |
|
Global Forex & CFD Broker |

Best Trading Conditions
Visit broker
|
|
|
| #2 |
|
Global Forex Broker |
BEST SPREADS
Visit broker
|
|
|
| #3 |
|
Globally regulated broker |
BEST CUSTOMER SUPPORT
Visit broker
|
|
|
| #4 |
|
Global CFD Provider |
Best Trading App
Visit broker
|
|
|
| #5 |
|
Global Forex Broker |
Low minimum deposit
Visit broker
|
|
|
| #6 |
|
Global CFD & FX Broker |
ALL-INCLUSIVE TRADING PLATFORM
Visit broker
|
|
|
| #7 |
|
Global Forex Broker |
Low minimum deposit
Visit broker
|
|
|
| #8 |
|
CFD and Cryptocurrency Broker |
CFD and Cryptocurrency
Visit broker
|
|
|
|
|
|||||

Forex Fraud Certified Brokers

Stay up to date with the latest Forex scam alerts
Sign up to receive our up-to-date broker reviews, new fraud warnings and special offers direct to your inbox