Concern about inflation continues to stalk the markets. The Dow Jones Industrial Average on Tuesday recorded its largest single-day fall since February. At one time, the intraday price plunge was as much as 434 points. Crucially the correction by 250 points (0.7% of its value) in the first hour of trading on Wall Street is a key indicator of sentiment. The all-important first 60 minutes of trading closed with the index at 34239 and attempts by the index to break back above that level proved futile. When the European indices opened on Wednesday, the DJIA was still trading below 34239 at 34219, suggesting investors are still erring on the side of caution.
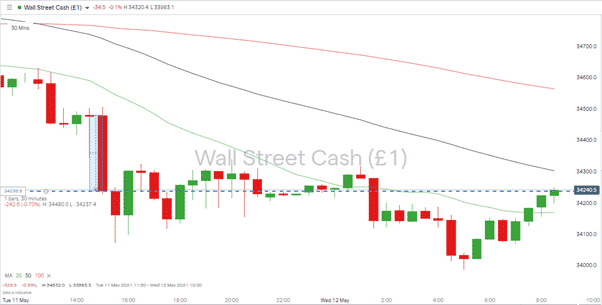
Source: IG
The increasing risk of inflation weakening equity prices was highlighted in Monday’s Forex Fraud report on jobs data and wage-led inflation. US retail sales figures data due out on Wednesday will consider demand-led inflation and appears to be the primary cause of concern in the markets. It could well be that prices continue to trade sideways until the numbers are released at 8.30 am (EST) because, for many, inflation holds the key to which way the market moves next.
The US consumer price index is expected to report a 0.2% increase from the previous month. That would represent a 3.6% spike from the same time last year, which is some way above the Fed’s target rate of a minimum 2%. Equity investors, in particular, are spooked by inflation as historically it’s been inversely correlated to stock prices. The Fed isn’t denying the actuality of price rises but has taken to calling them “transitory”. What that means is anyone’s guess, as shown by the DJIA being down 1.64% week to date. The big doji candle on the daily chart, which saw its lower wick price level breached in Tuesday’s price crash, will also be causing alarm from a technical perspective.
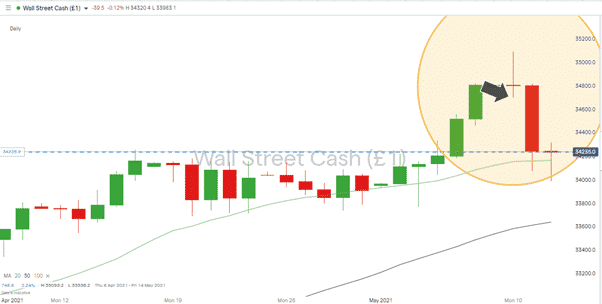
Source: IG
Is This a Time to Buy the Dips?
Given the record-breaking 10-year track record of equity indices, there will be an obvious temptation to buy at current levels. There isn’t a particularly clear supporting trend-line to use to identify any break to the downside being confirmed, but price doesn’t yet look to be plummeting out of its upward channel.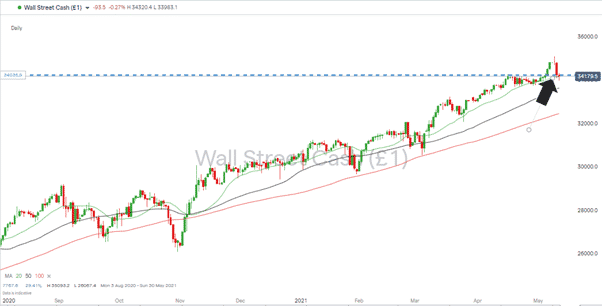
There is definitely room for further downward price moves in the DJIA. Price is currently sitting below the 20 SMA, which has been a critical support for months. If price doesn’t haul itself back above the 34162 level, then the next major support, the 50 SMA, is some way off at 33636. The 100 SMA came into play as recently as March; that currently sits at 32461. Any test of the 100 SMA average would mark a 7% fall in value from recent highs. With petrol shortages and Israeli-Palestinian tensions, there appear to be too many variables for dip-buyers to have confidence. If they don’t step in, as they have so often tended to do in the past, price would be weakened further.
Source: IG
If you want to know more about this topic, or have been scammed by a fraudulent broker, please contact us at [email protected]
Related Articles
- Forex vs Crypto: What’s Better For Beginner Traders?
- Three Great Technical Analysis Tools for Forex Trading
- What Does Binance Being Kicked Out of Belgium Mean for Crypto Prices?
- Crypto Traders and Coin Prices Face New Challenge as Binance Gives up its FCA Licence
- Interpol Declares Investment Scams “Serious and Imminent Threat”
- Annual UK Fraud Audit Reveals Scam Hot-Spots
Forex vs Crypto: What’s Better For Beginner Traders?
Three Great Technical Analysis Tools for Forex Trading
Safest Forex Brokers 2025
| Broker | Info | Best In | Customer Satisfaction Score | ||
|---|---|---|---|---|---|
| #1 |
|
Global Forex Broker |

BEST SPREADS
Visit broker
|
|
|
| #2 |
|
Globally regulated broker |
BEST CUSTOMER SUPPORT
Visit broker
|
|
|
| #3 |
|
Global CFD Provider |
Best Trading App
Visit broker
|
|
|
| #4 |
|
Global Forex Broker |
Low minimum deposit
Visit broker
|
|
|
| #5 |
|
Global Forex Broker |
Low minimum deposit
Visit broker
|
|
|
| #6 |
|
CFD and Cryptocurrency Broker |
CFD and Cryptocurrency
Visit broker
|
|
|
|
|
|||||

Forex Fraud Certified Brokers

Stay up to date with the latest Forex scam alerts
Sign up to receive our up-to-date broker reviews, new fraud warnings and special offers direct to your inbox