The positive US jobs report might have lit a fuse under equity markets, the Russell 2000 index in particular.
Jobs Numbers Beat Forecasts
On Friday morning, the consensus among Wall Street analysts was that US firms would have added 675,000 new employees in March. The actual figure released as part of the Non-farm Payrolls report was a headline-grabbing 916,000 extra jobs.
Despite many markets being closed for the Easter holiday, stock futures in key global indices spiked in the good news. Within the last two weeks, the US Federal Reserve had pointed to low-interest rates remaining in place for the foreseeable future, even if employment levels picked up. Sensing a win-win, equity traders bought heavily into cyclical stock indices such as the Dow Jones Industrial Average and Russell 2000.
US Russell 2000 index – 5-minute price chart
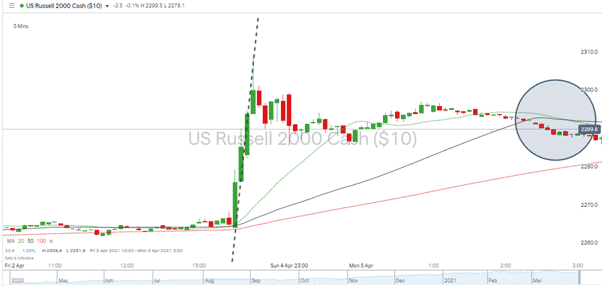
Source: IG
In the 20 minutes following the Non-farm Payrolls report’s release, the Russell 2000 increased in value by 1.96%. The momentary spike above the 2300 price level didn’t hold, but price has continued to consolidate below that level. A further reason to suggest another surge could be on the way soon was the 5min moving averages also managing to catch up with price just before the US close.
The Russell 2000 has for a while been the index to watch. Its all-time high of 2367 on the 15th of March, forming the latest milestone of its one-year and counting bull-run.
The index is now up more than 137% from its low on the 18th of March 2020.
On the daily price chart, the moving averages are all pointing to further price rises. The 20 SMA at 2266 sitting above the 50 SMA at 2257, which is in turn above the 100 daily SMA at 2152.
US Russell 2000 index – Daily price chart
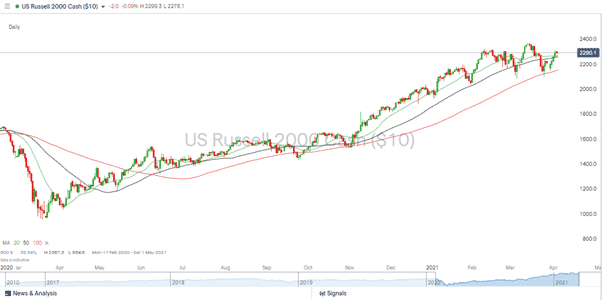
Source: IG
The long-term nature of the price surge means that the daily RSI is far from oversold. The monthly price chart RSI is printing above 70, but on two of the last three times that happened, price weakness was only a momentary blip.
US Russell 2000 index – Daily price chart
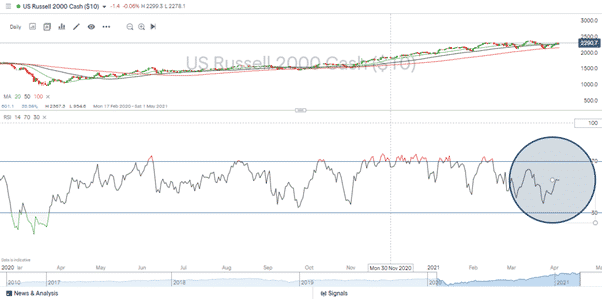
Source: IG
US Russell 2000 index – Monthly price chart – RSI
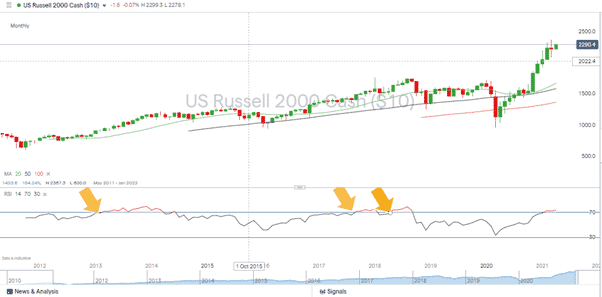
Source: IG
Recent comments from the US Federal reserve point to Jerome Powell and his team currently being comfortable with some sectors of the economy overheating. Their priority is to create a benign monetary environment so that the hard-to-reach sectors such as air travel and entertainment can begin to recover.
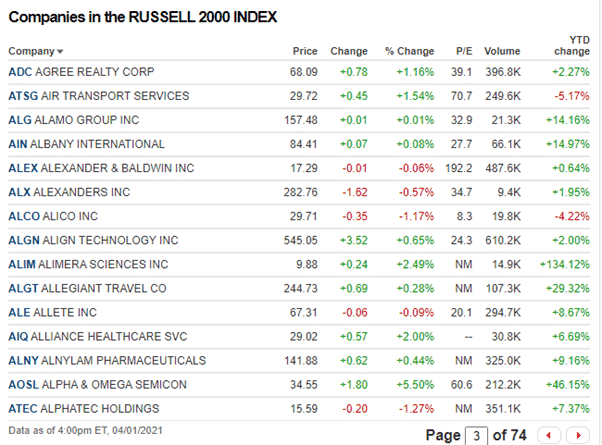
That is good news for stocks in the Russell 2000, which can be bought individually and via the index.
Source: CNN
Health Tech firm Alimera Sciences Inc is up 134% on a year-to-date basis, but most firms in the index are posting green rather than red YTD percentage returns, several in double-figures.
Alimera Fundamentals
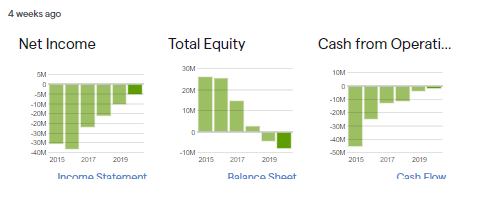
Source: IG
Alimera would appeal to investors with a sense of adventure. The Georgia based company is yet to turn a profit but exemplifies the kind of growth stock the Russell 2000 index contains. It’s listed on the Nasdaq index under ticker ALIM.
If you want to know more about this topic, or have been scammed by a fraudulent broker, please contact us at [email protected]
Related Articles
- Forex vs Crypto: What’s Better For Beginner Traders?
- Three Great Technical Analysis Tools for Forex Trading
- What Does Binance Being Kicked Out of Belgium Mean for Crypto Prices?
- Crypto Traders and Coin Prices Face New Challenge as Binance Gives up its FCA Licence
- Interpol Declares Investment Scams “Serious and Imminent Threat”
- Annual UK Fraud Audit Reveals Scam Hot-Spots
Forex vs Crypto: What’s Better For Beginner Traders?
Three Great Technical Analysis Tools for Forex Trading
Safest Forex Brokers 2025
| Broker | Info | Best In | Customer Satisfaction Score | ||
|---|---|---|---|---|---|
| #1 |
|
Global Forex Broker |

BEST SPREADS
Visit broker
|
|
|
| #2 |
|
Globally regulated broker |
BEST CUSTOMER SUPPORT
Visit broker
|
|
|
| #3 |
|
Global CFD Provider |
Best Trading App
Visit broker
|
|
|
| #4 |
|
Global Forex Broker |
Low minimum deposit
Visit broker
|
|
|
| #5 |
|
Global Forex Broker |
Low minimum deposit
Visit broker
|
|
|
| #6 |
|
CFD and Cryptocurrency Broker |
CFD and Cryptocurrency
Visit broker
|
|
|
|
|
|||||

Forex Fraud Certified Brokers

Stay up to date with the latest Forex scam alerts
Sign up to receive our up-to-date broker reviews, new fraud warnings and special offers direct to your inbox