Bitcoin’s price moves are currently proving to be one of the fascinating features of the financial markets.
Whipsawing price action has become something of a trademark for the crypto; however, at current levels the moves are becoming more extreme. The proximity to the mystical $20,000 price level is also providing a visual marker to bring the moves into focus.
There is also a will-it, won’t-it feel to the market. Some who got into long positions with 20k in mind have decided they want to get off the rollercoaster and don’t mind doing so a little bit early to ensure they lock in their profits.
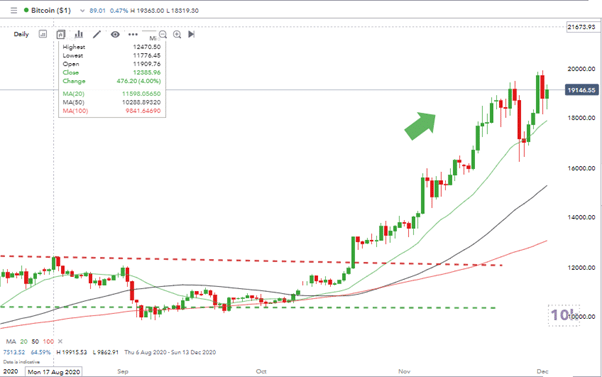
Source: IG
The Daily price chart shows price action that can only be described as bullish – the pullback on the 26th of November being well supported by the Daily 20 SMA.
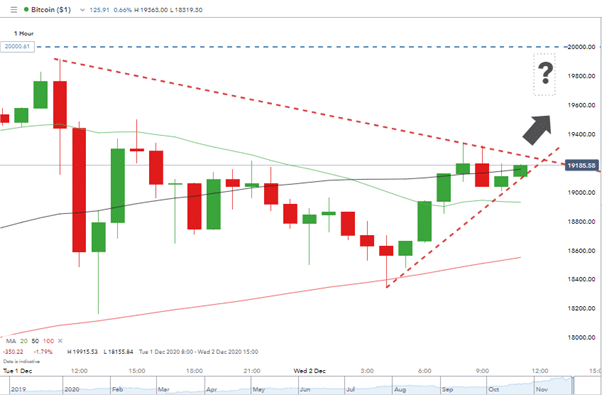
Zooming in on events of this week provides more colour on how the price is flying around.
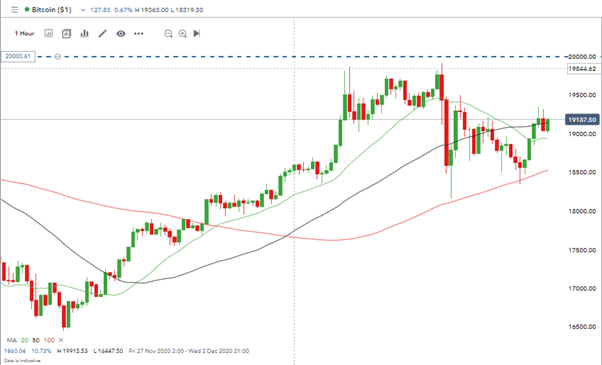
Source: IG
The hourly price chart shows price twice failing to touch, let alone break the $20k level. Anyone holding on and hoping for a quick break and a drive onwards to $30k might be reminded that it’s never a bad idea to bank a profit.
Pullbacks on the daily chart show the 50 SMA offering support but trading under the 100 SMA which is now forming resistance.
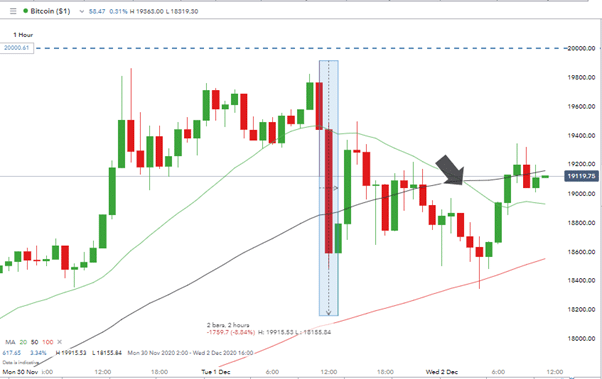
Source: IG
In the three hours before the US markets opened on Tuesday, BTC gave up 8.84% of its value. Such moves aren’t unheard of but even for Bitcoin that is a significant swing. It points to a lot of traders having stop losses close to the $20k mark and any weakness in price hitting those. As that circle continues, more stops are hit and a trickle of selling becomes a flood.
Those who bought in after that dip may have been thinking that those open to the idea of selling had been flushed out. That may not be the case with the arrow highlighting a less rapid but equally strong period of selling pressure in Asia and Europe on Wednesday.
Source: IG
Daily, price is forming a wedge pattern. Is this the consolidation before breaking $20k?
It would probably be one of the surprises of 2020 if BTC between March and December increased in value by more than 400% but fails to find enough support to hit $20,000. The current year-to-date high of $19,915 was posted on Tuesday and an upwards break of the wedge would suggest the 20-level is coming back into play.
With things hanging in the balance, many will be watching rather than trading the crypto. The good thing about Bitcoin is it is such a volatile market that you don’t always need a position in play to maintain your interest. It’s also the case that you don’t usually have long to wait for something interesting to happen to find out if you were wrong or right.
The Forex Fraud analysts were forced to give an opinion. The suggestion is that the price will touch $20,000 before trading below current levels by the end of the week.
Related Articles
- Forex vs Crypto: What’s Better For Beginner Traders?
- Three Great Technical Analysis Tools for Forex Trading
- What Does Binance Being Kicked Out of Belgium Mean for Crypto Prices?
- Crypto Traders and Coin Prices Face New Challenge as Binance Gives up its FCA Licence
- Interpol Declares Investment Scams “Serious and Imminent Threat”
- Annual UK Fraud Audit Reveals Scam Hot-Spots
Forex vs Crypto: What’s Better For Beginner Traders?
Three Great Technical Analysis Tools for Forex Trading
Safest Forex Brokers 2024
| Broker | Info | Best In | Customer Satisfaction Score | ||
|---|---|---|---|---|---|
| #1 |
|
Global Forex Broker |

BEST SPREADS
Visit broker
|
|
|
| #2 |
|
Globally regulated broker |
BEST CUSTOMER SUPPORT
Visit broker
|
|
|
| #3 |
|
Global CFD Provider |
Best Trading App
Visit broker
|
|
|
| #4 |
|
Global Forex Broker |
Low minimum deposit
Visit broker
|
|
|
| #5 |
|
Global CFD & FX Broker |
ALL-INCLUSIVE TRADING PLATFORM
Visit broker
|
|
|
| #6 |
|
Global Forex Broker |
Low minimum deposit
Visit broker
|
|
|
| #7 |
|
CFD and Cryptocurrency Broker |
CFD and Cryptocurrency
Visit broker
|
|
|
|
|
|||||

Forex Fraud Certified Brokers

Stay up to date with the latest Forex scam alerts
Sign up to receive our up-to-date broker reviews, new fraud warnings and special offers direct to your inbox