An aggressive sell off by US, European and Asian equity markets from last Friday, which could very likely extend early this week.
This activity has been driven by the perception of a potentially more hawkish FOMC and further equity index weakness would likely be accompanied by US $ gains against most G8 currencies.
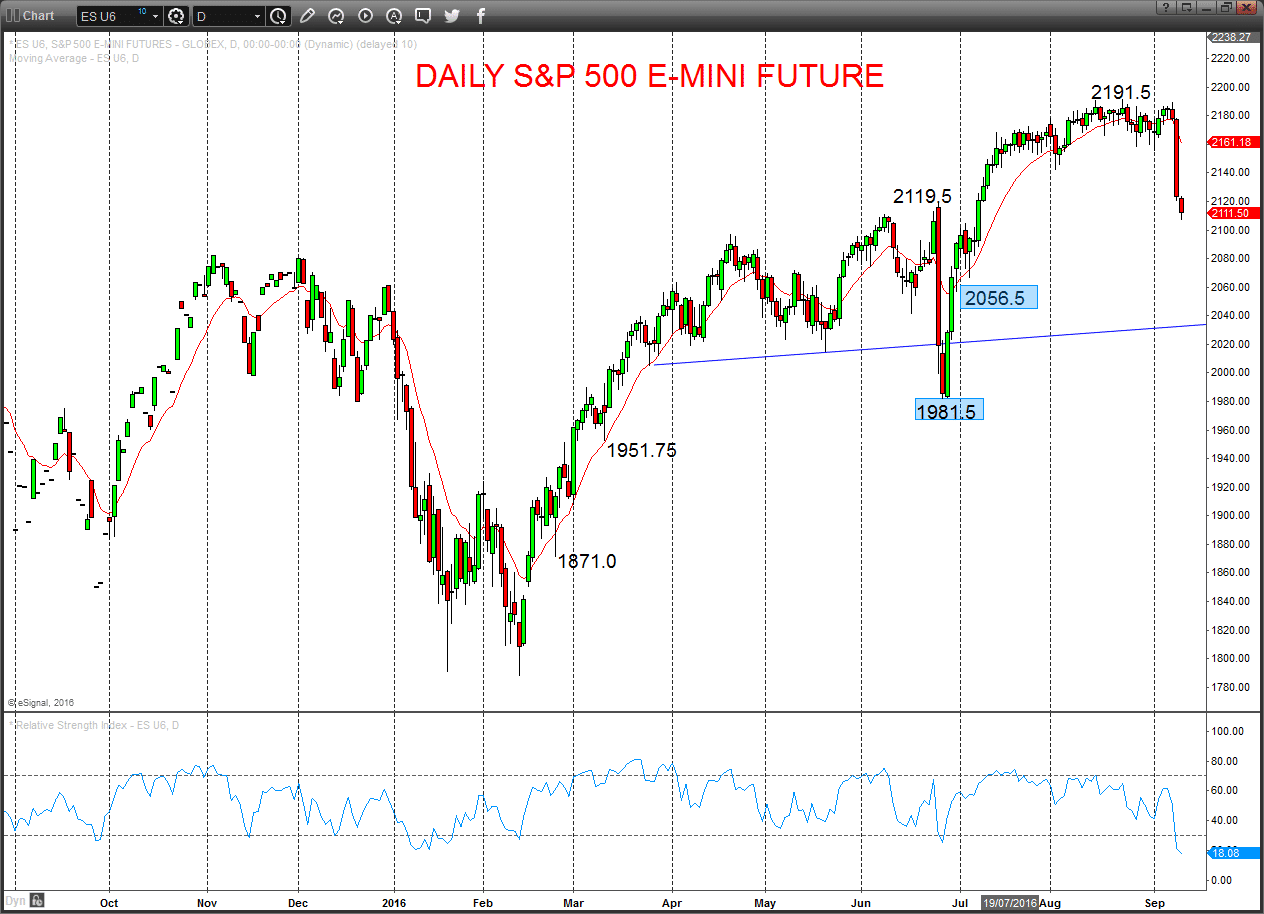
S&P 500
A very aggressive Friday plunge and again already this morning, to reject the attempted rebound efforts for early September and the resilient consolidation theme evident through the summer, to wipe out multiple supports and keep the immediate risks lower for Monday.
For Monday:
- We see a downside bias for 2103/02; break here aims for 2087.5, 2081.75 and 2065.75. We would look for 2056.5 to try to hold.
- But above 2122.0 opens risk up to 2141.25, maybe 2156.25.
Short/ Intermediate-term Outlook – Upside Risks:
- Whilst above 2056.5 we see a positive tone with the bullish threat to 2200.0.
- Above here targets 2225.0 and maybe 2235.25.
What Changes This? Below 2056.5 signals a neutral tone, only shifting negative below 1981.5.
Daily S&P 500 Future Chart
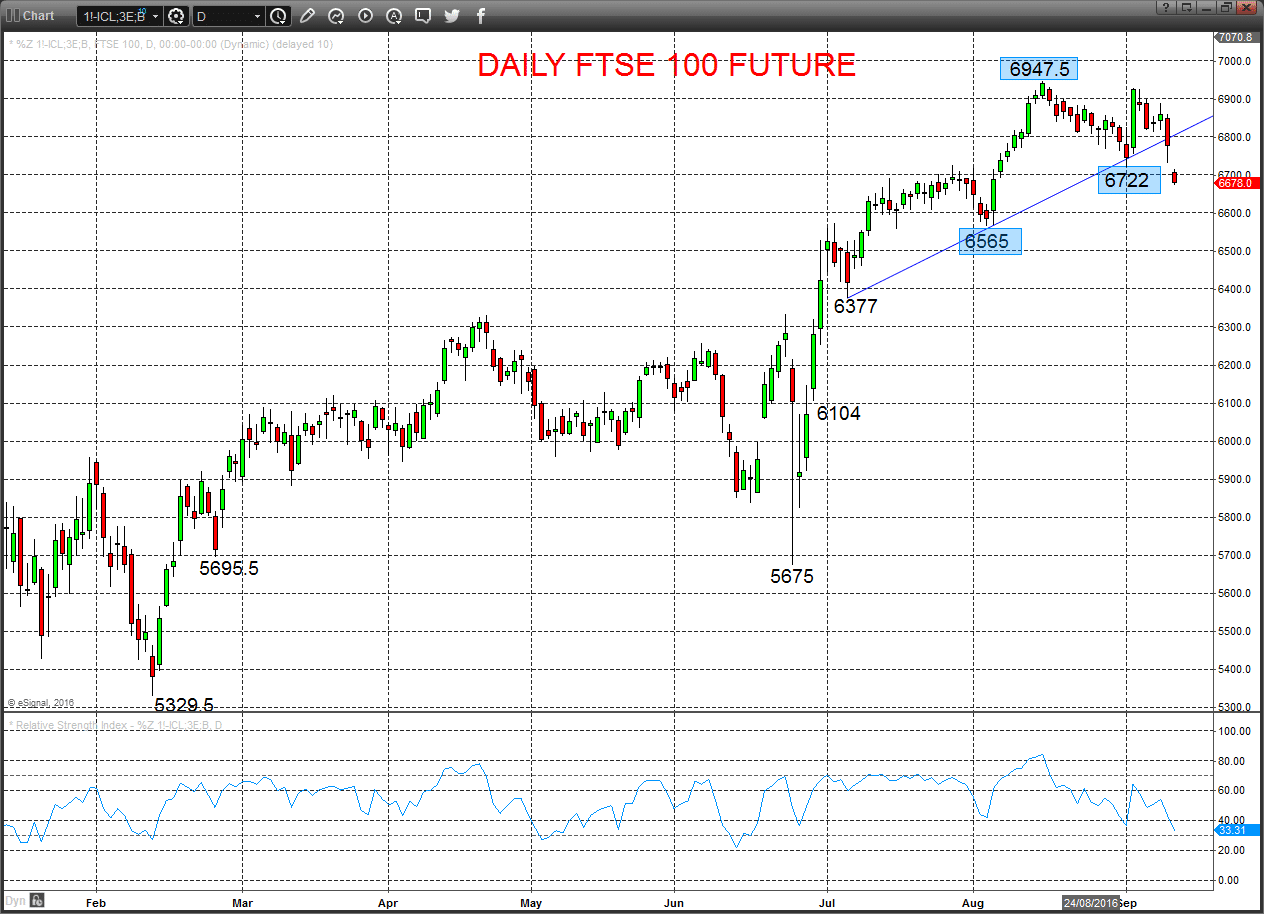
FTSE 100
An aggressive Friday breakdown to reject the Thursday rebound, to surrender multiple chart supports (including 6754) and a bear gap already this morning (6716-32.5) to keep the risk for a deeper correction Monday.
Furthermore, the push through 6722 has signalled an intermediate-term shift from a bullish tone, to a neutral range theme.
For Monday:
- We see a downside bias for 6667.5; break here aims for 6640/35 and maybe 6592 (even key 6565).
- But above 6716-32.5 opens risk up to 6786.5.
Short/ Intermediate-term Range Parameters: We see the range defined by 6947.5 and 6565.
Range Breakout Challenge
- Upside: Above 6947.5 aims higher for 7000 and the record high at 7085.5.
- Downside: Below 6565 sees risk lower for 6377 and 6104.
Daily FTSE 100 Future Chart