In addition to fundamental analysis to help you find the right trading opportunity, there exists technical analysis, which focuses and studies charts in order to figure out the future price action based on historic data by using diagrammatical analysis.
There are three principals at play with technical analysis.
- The market action discounts everything
That is – a stock’s price reflects everything that is affecting it in all sectors including fundamental factors, psychology of the market and economic factors.
- Prices move in Trends
Price movements follow trends where technical analysis tends to follow. Trends typically continue then reverse, but technical analysis can also go against the trend.
- History repeats itself
It is assumed that previous patterns based on trader psychology appeared to work so they will continue to work in the future as basic psychology doesn’t change.
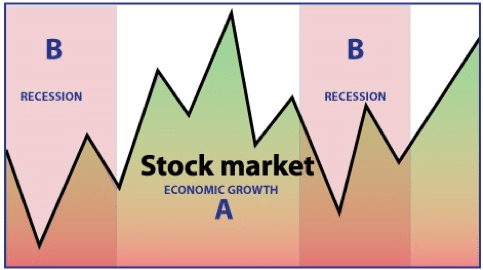
By watching the financial markets, it becomes clear that there are trends, momentum and patterns that repeat over time. They are not exactly repetitions, but sufficiently similar. This occurs in stocks, commodities, currencies and bonds. A Chart is similar to a window, that reveals the mood of the traders and doesn’t reflect the fundamental factors.
The patterns we recognise on stock markets when the cycle of recession and growth occurs.
A selection of the different graphs from which to find your trading opportunity follow:
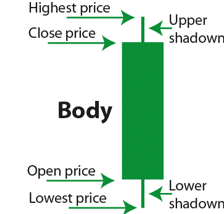
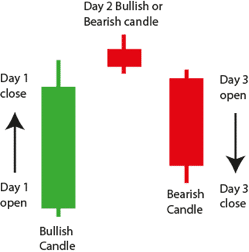
- Candlestick Charts
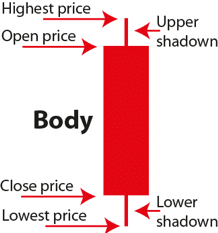
Indicate high, low, open and close price for each period.
Up-day are usually green and indicate if the closed current period is great or equal to the open of the current period.
Down-day indicates if the close of the current period is less than open of current period.
Two common candlestick patterns are Morning Star – this pattern is regarded as a trend reversal of a downtrend motion and consists of a pattern between three candlesticks. A relatively long bearish candlestick that is then followed by a short bullish, or bearish doji candlestick, and the third being a long bullish candlestick at least half way up the body of the first bearish candlestick.
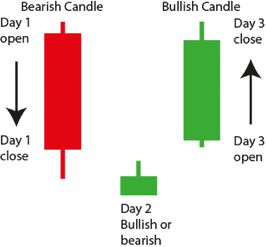
Evening Star: The pattern is regarded as a trend reversal of an upwards trend motion and it consists of a pattern between three candlesticks. A relatively long bullish candlestick that is then followed by a short bearish, or bullish doji candlestick, and the third being a long bearish candlestick at least half way down the body of the first bullish candlestick.
In addition, basics on technical analysis such as trends, Moving averages, Bollinger Bands, RSI, and Elliott Waves will be covered in the following articles.
Use of the tools available to traders to find profitable trading.