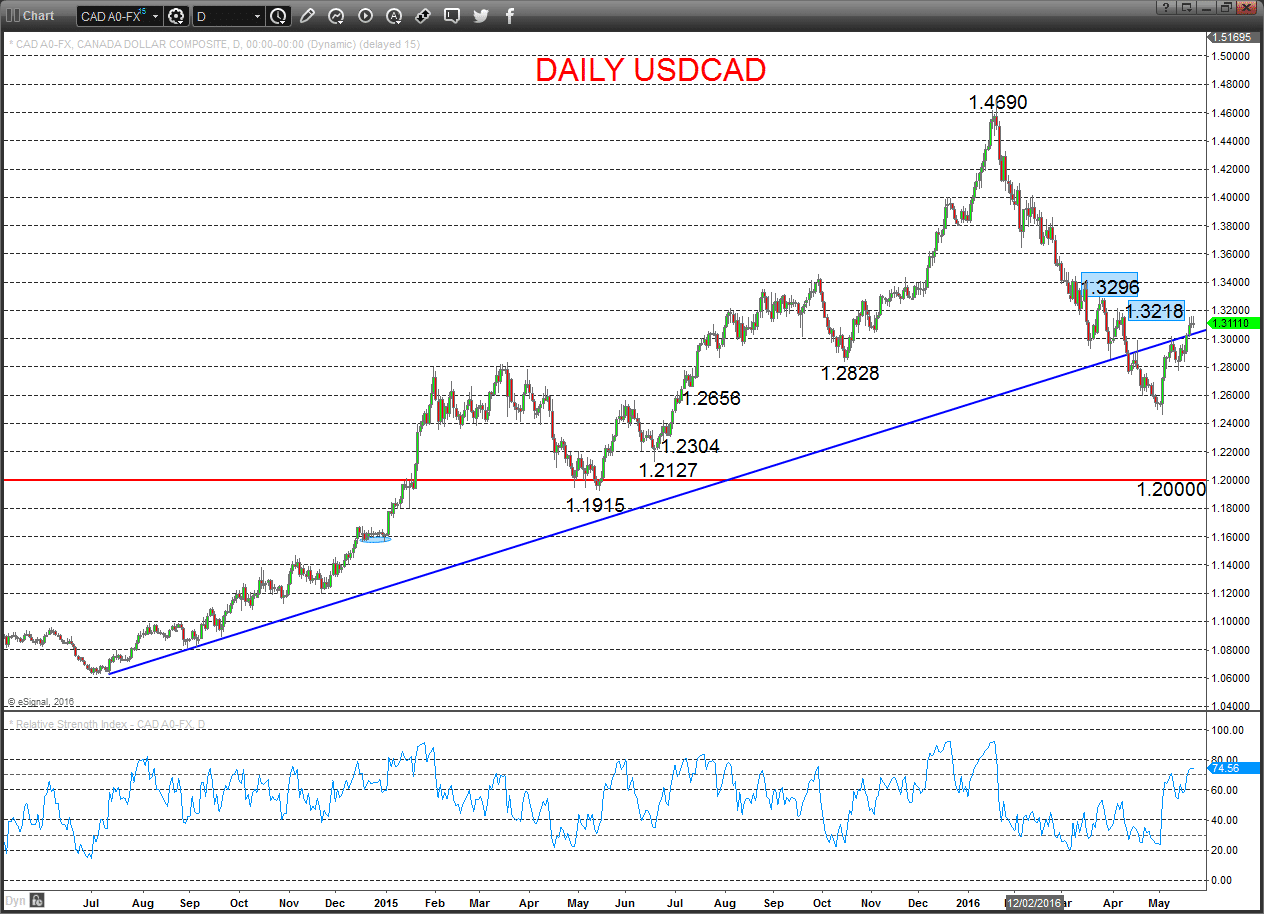
The 2014-early 2016 USDCAD rally was highly inversely correlated with the Crude Oil sell off through the same period and the Oil rebound from mid-January- early May this year has also seen high correlation (inverse).
However, for May, the USDCAD bullish correction has, for much of the time, seen the Oil price rebounding too, with US Dollar strength playing a more significant role.
The risks into latter May and June are for an ongoing USDCAD rise (maybe through critical level at 1.3218 and 1.3296), maybe assisted by a roll lower in the Oil price at some point.
USDCAD
A prod higher to another new correction high on Friday reinforced the firm advance through 1.3100/10 and Wednesday rally through the FOMC April Minutes, to leave upside risks again Monday.
The still growing threat is for a May push above 1.3218 to neutralised the intermediate-term bearish theme.
For Today:
- We see an upside bias for 1.3162; break here aims through 1.3181 for the key 1.3218 level.
- But below 1.3042 opens risk down to 1.2978.
Short/ Intermediate-term Outlook – Downside Risks: A bearish shift in the intermediate-term outlook was signalled below 1.3360.
- We see a negative tone with the bearish threat to 1.2304.
- Below here targets 1.2127 and 1.2000.
What Changes This? Above 1.3218 signals a neutral tone, only shifting positive above 1.3296.
Daily USDCAD Chart
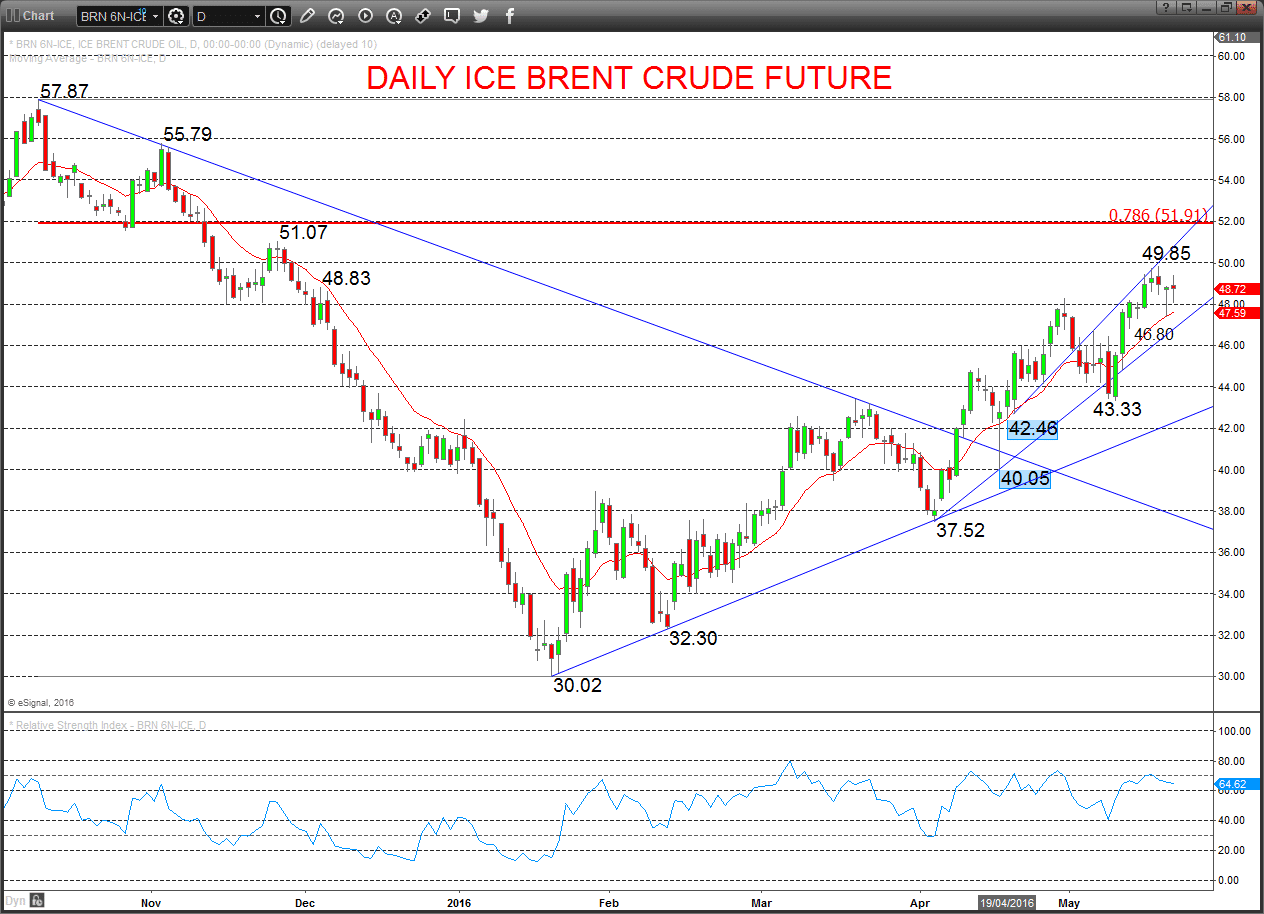
Brent Crude Oil – July 2016 Contract
A consolidation tone Friday, after a bearish outside Wednesday back from a new recovery high but a Thursday rebound for a Hammer candlestick (bullish), to set a further consolidation theme for Monday.
For Today: We see a neutral tone between 49.85/50.00 and 48.07.
- Break above 49.85/50.00 aims for 51.07, which we would look to try to cap.
- Break below 48.07 aims for 47.38/26, which we would look to try to hold.
Short/ Intermediate-term Outlook – Upside Risks:
- We see a positive tone with the bullish threat to 50.00.
- Above here targets 51.07, 51.91 maybe 55.79.
What Changes This? Below 42.46 signals a neutral tone, only shifting negative below 40.05.
Daily ICE Brent Crude Future Chart